Crowdsourcing
Course about Datavisualisation with the help of html5, java script, tabletop.js, jquery and google spreadsheet
View the Project on GitHub JulianWohlleber/PJ2_TravelBehaviours
PRJ2_TravelBehaviours
This was probably one of the hardest task, I had in this course. The task was to generate Data and do a Datavisualisation with it, which should later be published on a Webpage online.
IDEA
After some time thinking, I decided to generate a Survey about the daily travel distances and their impact on the transportation-method and the effects of health. I generated the Survey with Google Survey, because Google Survey offers the best ways to publish the generated data, which later was really relevant for the built of the Html-Page.
Get to the Survey.
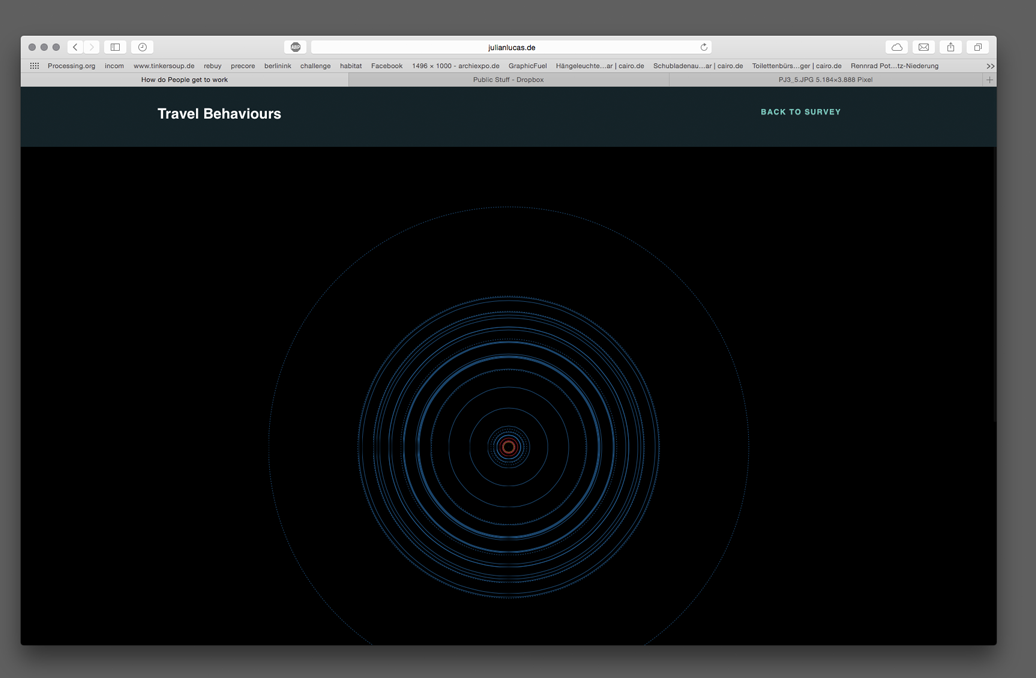
REALISATION - Website 1.0
When I started to write the Webpage, I first was really really lost. I never had made any experience before with html, much less I had never heard of css. The only thing that I understood a little was java script with the help of p5, which is a library that makes java script feel and work pretty similar to processing. When I succeeded after a few hours to built a Webpage like I wanted it (Html only, no Java Script, precasted css), I decided to start with the java script part. After hours of work, I had... yeah - actually still nothing. I simply didn't understand arrays, and how I could use the contend of the google spreadsheet in my code. After some more time struggeling I felt really low, and decided to just built the Visualisation manually with Illustrater, export the document as a PDF and and just implement that into my webpage. I wasn't really proud of this solution, but I just didn't had the time to finish it properly.
Finish
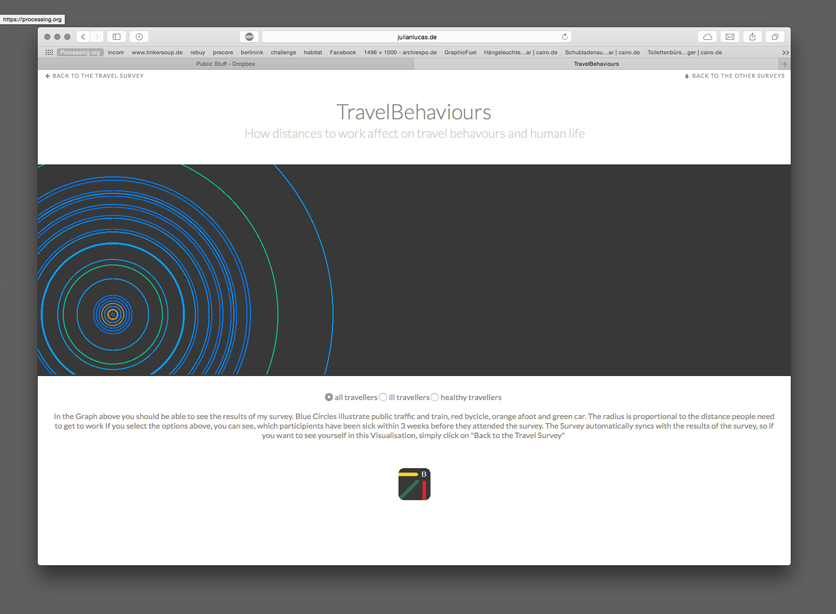
When my vacation started and I had done all my dokus for my other subjects, I decided to finish what I started so far. After an 8-hour-youtube-course I understood the basics of java script. I could now use arrays, link a java script into html, link buttons of a html page to java script (after some time of practise), and after some more hours of research was able to use the data of the online spreadsheet via tabletop.
I searched for a nice css, built the html page, and after a lot of time, also finished the java script.
I'm really proud that I've built my first Webpage, and I'm happy, that I invested so much time, because coding seems to be like reading or writing. Once you've learned something, you do not forget it, or at least learn it fast again.
There are still some issues I had with the page, for example that I wasn't able to fit the Canvas into the window-width, which sometimes generates unlovely grades between the html section and the canvas, but I think I should be able to fix this in some time.
 )
)